Wednesday, May 31, 2017

SPH: Final downside target hit at 3.20.... is the worst over? Price 3.21


Just last month, we saw some weakness in SPH and clients were alerted.... it staged a slight rebound but only to be met with more heavy selling....


All the way to where our arrows are drawn previously (See below).


Fundamentally, it has seen earnings coming in below expectations with conditions expected to remain challenging for its media business. Momentum indicators were also pointing negative then.


See what I mean!  ;)


For illustration purpose only


Finally we have seen it hit our final target at 3.20 today as per the arrows drawn in the chart previously.


Currently, we are seeing some rebound or short covering near 3.20 which is normal. 


May also see a temp technical rebound back to 3.25 – 3.26 before seeing selling again.


However, as long as 3.26 is a resistance, we can still see more weakness.


Any firm price action below 3.20 can see a new recent low to 3.10 then 3.00, I won’t be surprised, cautious long....


From the system, yes we had some BEARISH SIGNALS.... still there.....


Not yet a client? Click here to be One!


Tuesday, May 30, 2017

Memtech Intl: Some profit taking today.... but upside over? Price 0.95


Just last Friday, we saw a move in Memtech above the key 0.900 level when it was at 0.91….


And a note was sent out with chart as seen below….


It started trade all the way to a high of 0.975 yesterday before some profit taking today….


For illustration purpose only


Was looking at the system and saw that we had a bullish signal in March…


But there was actually AN EXIT few weeks back…. So is it over?


The thing is, are we seeing another BULLISH RE-ENTRY SIGNAL?


Yes… last week….


PTI Grads can check to see…. Shhhh….. ;)  


Will probably show the signals on the system next time!


Monday, May 29, 2017

Sunright: Saw something, move came. Still good from system? Price 0.585


Just last Friday, we saw some actions in this counter called Sunright.


It was approaching its 0.54 key resistance level…..


See the chart below where some targets were drawn…. Was at about 0.545 then


For illustration purpose only


Indeed, the move strengthened and it started to push up higher at day end with buyers not letting go….


We started to see more strength today with it almost hitting our first target at 0.60.


High as of now is 0.59…


More importantly, inner circle members were alerted to this on the system….


We had a BULLISH SIGNAL on my Explosive 1ET strategy last week just before the move came…


Glad that everyone know why the signal is there…. I mean like why there is a signal…. 


That’s so powerful to me!


No exits for now........


Looking to see when the 0.600 level will clear out to give way to more buyers....


Not yet a client? >>> Stop missing out!!! >>> Click here to Be One!


Friday, May 26, 2017

BreadTalk: Target hit... BUT is it really over? System says? Price 1.605


Just last week, a note was sent out when we saw something in Breaktalk…..


It was a move above the 1.50 resistance level which was interesting and could point to more upside….


See what was sent out below….  where there were arrows drawn on the chart…. J


For illustration purpose only


True enough, we have indeed seen Breaktalk pushed higher over the past few days to hit our target at 1.60…..


Target hit!!!


The thing is, it is looking to even cross this temp resistance today too…..


In the last email, I also mentioned that we saw something on the system


What thing?


Well, a signal!!!!


Just wanted to pull it out since a client has asked about it so here it is below….


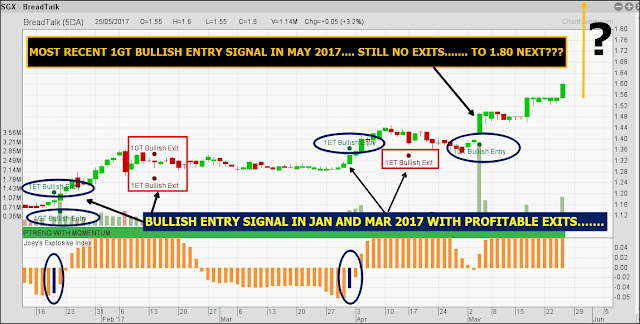
We got a 1GT BULLISH ENTRY SIGNAL, 4TH May 2017….


Yes, it has started to push higher till now…..


For illustration purpose only


The thing is, we are still not seeing any EXITS ON THIS counter yet….


And the uptrend still looks fairly ok to ride…. J


Your call..


PTI grads can check back to see when the exit will come eventually….. protect profits now….


Thanks to this system that makes it so much easier for me and also my grads…..  


We are right below now in terms of a live chart…. Can the price continue to rise like the arrow BELOW?


Be a client of Joey to be in the loop at least J >>> CLICK HERE


For illustration purpose only


Thursday, May 25, 2017

Frencken: Still continuing the upticks.... inner circle rode, may still be good as per system... Price 0.525


About 2 weeks ago, we were alerted on my SYSTEM to some BULLISH Signals from one of this counters that was never in my radar....


The counter is called Frencken....


Specifically, we had a 1ET and 1GT BULLISH entry signal....


Both completely different strategies, both pointing to the same direction.... and what more....


On the very SAME DAY.... 9TH May 2017..... with entry price at 0.39....


A few days later, the ascent began... all the way to a high of 0.53 today..... see what i mean below.


And of course, there were several follow ups alerts by inner circle.....


For illustration purpose only


We are looking at a 34.6% gain in 2 WEEKS.... and counting....


Why counting.....


Because there is still NO EXITS on the system yet......


So can it go to 0.60 and maybe even 0.80 next?


Why not....?


I mean, we would ride and of course make sure we don’t lose money now that we have already made them....


PTI grads would know what i mean.... and of course what to do exactly....


And the main thing I am proud of is, everybody knows WHY the DOT WAS there....


I mean if you can tell me to put the dot there means you know exactly what is going on... and that to me is much more important. J


So for now what to do, your call......  J


We will be looking at when to take some money of the table.... just saying....


For illustration purpose only


Wednesday, May 24, 2017

Sunningdale Tech: Saw something 2 weeks back, then actions again.... price 1.885. System?


Just about 2 weeks ago, we saw some actions in this counter call Sunningdale Tech….


In fact, the system actually showed something… PTI grads can check…..


A bullish entry signal…..


But let’s take a look at the chart below that was shown about 2 weeks back when it was about 1.83….


Arrows still seems to be playing out well…..


After consolidating for about 2 weeks above 1.80, finally we are seeing some actions again today with the target still on track.


So can we see the move towards 2.00 then even 2.20 next as per the arrows drawn above?  J


Well, would be looking to see what the system says…..


And when the exit will come? For now, still looking awesome….


Protect profits for now for those who had locked in together with us….. J


Client of Joey yet? No?  >>>>> Be One, CLICK HERE !


Monday, May 22, 2017

Food Empire: An exit, but we spotted something last week finally.... where to? Price 0.72


We mentioned about the bullish signals in Jan 2017 having no exits.... See system below again.


For illustration purpose only


The thing is the exit did come.... somewhere in February...


And it has then been consolidating sideways below the 0.64 level all this while.....


Till we spotted something last week..... let’s see what we saw below...


For illustration purpose only


Target hit as per arrows drawn in the chart last week.... and


Today we are even seeing a push above the 0.700 again....


So can there be more room to go to 0.80 now?


More importantly, is there another Bullish RE-ENTRY SIGNAL ON THE SYSTEM AGAIN NOW?


PTI grads can check......


Be a client to be notified at least a little earlier..... J   >>> CLICK HERE <<<


Wednesday, May 17, 2017

UMS: The move really came, price 1.01. More upside?


Over the past few days, we have seen UMS broke the key 0.95 resistance level that it has consolidated below for more than a month.


Has been holding well over the past few days which is a genuinely good sign...


Was just looking at the chart this morning when it was at 0.98 and I sent out a note to prepare for a potential move above 1.00…


And then it started to see some strong buy ups in the afternoon with a new high at 1.02 as of now…


Can the arrows drawn earlier in the chart below play out? Target to 1.10?


Well, it remains to be seen….


Want to be notified as well? Be a Client! Simple. Click here.


For illustration purpose only


Tuesday, May 16, 2017

Hi-P: Still pushing higher, price 0.825. System saw it coming?


I mentioned that we were actually looking at another NEW BULLISH ENTRY signal after the previous exit.


Let's take a look at it today....


Well, we had a new 1GT BULLISH ENTRY signal on 21 Apr 2017…. (see below). Entry price 0.705.


For illustration purpose only


2 weeks back, it was trading at about 0.735 and was holding well above the new 0.700 support level…


A few days later, we started to see the rise….


That is another 12% GAIN IN a week….


We have seen it breached the psychological 0.800 resistance level over the past days again and still looking strong above….


Still no exits! 


Wonder when the exit will come…. Let’s see…. J


Anyway just, protect profits for now…. While still continue riding….


Want to get ideas like this in your inbox? Be A Client >>> Click here.


Monday, May 15, 2017

SIA Engineering: Testing the 4.00 for the next upwards phase, price 3.99. Did you ride since Jan?


Over the past few months, since first covering SIA Engineering in Jan this year, we have finally seen our target hit at 4.00 today…


Just to recap, in January, we were seeing it trade below the key 3.50 resistance level before some positive actions.


A breakout occurred above 3.50 eventually as predicted and up it went to about 4.00 now.


Note that any firm move above 4.00 can still see more strength towards 4.30 as per arrows drawn in the below chart.


Uptrend still looks firmly intact above 4.00 now.


For now, there can be some profit taking near 4.00 which is normal.... 


System wise, the bullish signal still has no exit, PTI grads can check.... shhh....


Feels good to see the arrows drawn on the charts months ago play out one after another...... J


Not yet a client of  Joey? Click here to be one.


--------------------------------------------------------


Recent Emails:

Sent: Thursday, May 11, 2017 10:07 AM
Subject: ***** SIA Engineering: May face some selling pressure near 4.00 for now, price 3.96

Sent: Tuesday, May 09, 2017 9:31 AM
Subject: ****** SIA Engineering: Upwards reversal still in progress, price 3.93

For illustration purpose only


Sent: Wednesday, February 08, 2017 11:51 AM
Subject: ***** SIA Engineering: Pushing higher, price 3.61

Sent: Tuesday, February 7, 2017 10:32 AM
Subject: ***** SIA Engineering: Finally a move again, price 3.57

Sent: Wednesday, February 01, 2017 10:57 AM
Subject: ****** SIA Engineering: Action came above 3.50 as mentioned, price 3.54

Sent: Thursday, January 19, 2017 3:25 PM
Subject: ******* SIA Engineering: Still consolidating but may see some actions soon, watching, price 3.48

For illustration purpose only


Friday, May 12, 2017

Noble: A Massive sell down! Could there be a hint of this on system ? price 0.65. More weakness?


After the share consolidation last week of 1 for 10, we have seen the price of Noble increase by about 10 times correspondingly back to above 1.00, at about 1.30.


But only to see more selling toward the key 1.00 support yesterday.


A note was sent out to still be cautious of the break down below 1.00 where it could trigger a flush of sell orders again....


See chart below when it was at 1.02 when the note was sent out..... hanging dangerously above the critical 1.00 support.... where there were some short covering...


For illustration purpose only.


But then it broke as predicted.... the sell down began fast and furious...


Target drawn in the chart at 0.800 and 0.600 has both been hit.


Low at 0.61 today....  A massive sell down indeed....


This question is did we get any clues way earlier that could lead use to know about the sell down, ok, maybe not that massive like yesterday and today, but at least a bearish indication to this counter.....


I mean a signal that allows us to know that we should not be thinking of buying this stock, longing it etc...


But instead think the other way round....


Shorting it and riding the downside for profits...


Looking back at the system with Noble’s prices adjusted for the share consolidation.... yes, there is still the 1ET BEARISH ENTRY SIGNAL, 17 APR 2017 (See below chart).


For illustration purpose only.


Looking at a 61.7% sell down from the sell entry price in just 3 weeks....


To be honest, I have no idea when the exit will come.


But till it comes out, I want to be careful on any long positions….. 


I mean probably still think about shorting on any slight technical rebound….


Congrats to inner circle members who were alerted by system and not just holding on blindly….. look out for the exit if it comes…. J


 --------------------------------------------------------------


Recent Emails:


Sent: Wednesday, May 03, 2017 9:17 AM
Subject: ***** Noble: The next support did not hold too, price 0.127

Sent: Tuesday, May 02, 2017 10:53 AM
Subject: ***** Noble: A new low again and some short covering but is the selling really over? Take a look at system too.... Price 0.141

For illustration purpose only.


System before the share consolidation.
For illustration purpose only


Thursday, May 11, 2017

Moya Asia: Almost hitting target, price 0.097..


Just last Thursday, we saw some actions in Moya Asia and a note was sent out the next day to clients.


Inner circle members were alerted of the potential move earlier of course..


Indeed it started to push higher over the past few days with a new recent high at 0.097 today.


Arrows drawn on chart below indeed still playing out well…


Looks set to head towards our first target at 0.100.


We may start to see some profit taking again near 0.100 before some consolidation again and probably more upside.


Congrats to those who were locked in.  J


What about the system? Does it tell us anything? Hint hint......


Not yet a client of Joey? Be one to be in the list, click here :)

------------------------------------------------


Recent Email:

Sent: Friday, May 05, 2017 9:19 AM
Subject: ********* Moya Asia: A new upwards phase again, price 0.086


For illustration purpose only


Tuesday, May 9, 2017

OCBC Bank: Target almost hit... price 10.43, still good to go?


Just last week, we saw the 3 local banks rally on stronger than expected results announced. There were some positive price action seen and a note was sent out on each of them to share on more upside likely.


True enough, all of them have managed to find a new recent high over the past week.


Over the past few days we have seen OCBC continue to inch higher even breaking above the 10.20 level over the past few days.


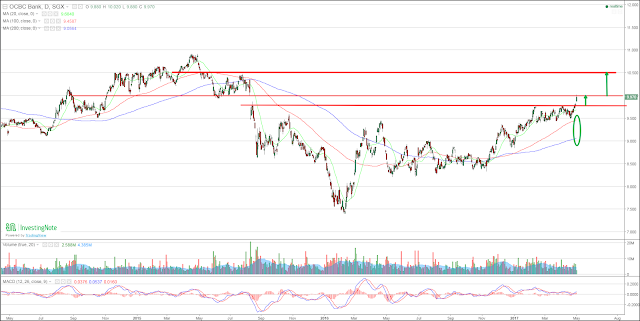
As mentioned, seems like OCBC is set to test our first target at 10.50 as drawn in the chart last week (See below).


Arrows are still playing out nicely. High at 10.43 seen today.


We may start to see some profit taking as we approach this level before more upside.


After 10.50, what level should we look at again? Be a client to find out, click here.


What about the system, yes we saw something interesting recently too, shhh....... PTI grads can check the system J


---------------------------------------------------------


Recent Email:


Sent: Tuesday, May 02, 2017 9:43 AM
Subject: ***** OCBC Bank: A move today seen as mentioned, price 9.96

For illustration purpose only


Sent: Wednesday, April 26, 2017 9:24 AM
Subject: ******* OCBC Bank: Still in consolidation range... price 9.74

For illustration purpose only


Monday, May 8, 2017

Addvalue Tech: Bullish signals still playing out.... price 0.066


Just about 3 weeks back, we saw some good bullish signals in this counter called Addvalue Tech.


Specifically on 13 April 2017, both my 2 completely different 1GT AND 1ET strategies had a bullish entry signal, entry price at 0.049.


It started to move up after a few days and we are looking at a 38.8% GAIN in 3 weeks…. and counting…


Because there is still no exits


Hit a new high at 0.068 today…


Poised to test next crucial resistance at 0.075 then 0.080… Let’s see…..


Will see when the EXIT signal will come…..?


For illustration purpose only


Riverstone: Breakout seen last week. A new upwards phase? Price 0.97


Just last Friday, we saw some pretty good price actions where it had broke above the key 0.94 resistance that it has traded below for about a year.


Inner circle members were alerted of course to take note and watch for more confirmation…


Today, we are again some buying coming back…. 


Is it pushing higher as per arrows drawn in chart below?


We may start to see more strength to 1.00 then 1.05 in the short term with this 0.95 support holding now.


Finally some actions after a year…. Let’s see. J


Be a Client to Enjoy Trading Ideas Delivered to your Inbox >>> Click here


For illustration purpose only


Thursday, May 4, 2017

Hi-P: Some strength returning again, price 0.735. Bullish exit but.....


Following up from previous blog post, I mentioned about Hi-P having no exits from the previous bullish signal >>> http://singaporetradinginsights.blogspot.sg/2017/03/hi-p-target-hit-some-profit-taking-seen.html


See chart again that was shown again here below....

For illustration purpose only


However just to share that we did see an exit eventually.


But, over the past few days we have seen some actions again after seeing a new bullish entry signal.


Today, it has started to pull away from the new support at 0.700....


System aside, still looking good above 0.700 imo...  J congrats to those still riding.


Will be looking to see when the exit will come again....  PTI grads can check and be alerted when it comes :)


Let’s see below where we are on a live chart now.....

For illustration purpose only


YZJ Shipbldg: Some actions seen as mentioned, price 1.22. More upside?


Had actually sent a note last Friday morning at 9.29am on YZJ Shipbldg when it was a 1.16 (See below chart).


Mentioned about a potential move above the key 1.20 level.....


Finally, the move came today. 


We have indeed seen the resistance at 1.20 gave way on some pretty decent price action as of now.


So looking at the chart drawn last week where the arrows are pointing to more upside..... Can it head to 1.35 next?


Anyway we did see something on the system, PTI grads can check.  J


-------------------------------------------------


Recent Email:


Sent: Friday, April 28, 2017 9:29 AM
Subject: **** YZJ Shipbldg: A good rebound back to key resistance before profit taking again, price 1.16


For illustration purpose only


Wednesday, May 3, 2017

Yuuzoo: A glance at system! Really No exits... May still see more selling, price 0.068


Over the past 1 month, we have spotted weakness in this counter Yuuzoo and several emails were sent to clients also to notify them on weakness.


This morning when it was at 0.075, I sent out an email saying that we can still see more weakness towards 0.070.


True enough, we have seen Yuuzoo tested the 0.070 indeed and again a sell down below after 1 hour.


Looks like there is no stopping the weakness for now with it breaking each temp support with no signs of stopping.


Anyway, a client ask if he can have a quick look at my system to see the outlook as I have mentioned about a bearish signal previously.


I took a picture and send him and thought why not share on the blog also, so here it is below.


For illustration purpose only


Yes, so as mentioned in previous email to clients as well, there really is a Bearish signal. On the 11 and 12 April 2017 specifically.


On my 2 completely different strategies.


As you can see also, after the signals, it started selling down like nobody business...


PTI Grads had access to this system and would have been alerted to not only get out BUT perhaps to also consider taking short positions to ride the weakness.


Just hope no one is holding on blindly to this counter like i have said in previous notes. Keep it simple I guess, see a signal to get out, just get out.


Yup, still no exits after 3 weeks.......


Just be careful below 0.070 ok.... I also have no idea how low this can go, we normally just ride where it takes us and protect short positions along the way...


Still not yet a client of Joey? You got to be kidding! 


------------------------------------------------


Recent Emails:

Sent: Wednesday, May 03, 2017 9:09 AM
Subject: ***** Yuuzoo: Downtrend intact, cautious long... price 0.075

Sent: Tuesday, May 02, 2017 9:26 AM
Subject: ******* Yuuzoo: More selliing, still no exit, weak..... price 0.078

Sent: Wednesday, April 26, 2017 9:47 AM
Subject: **** Yuuzoo: More selliing, no exit, weak..... price 0.089

Sent: Wednesday, April 19, 2017 9:19 AM
Subject: **** Yuuzoo: Support gave way as well, not good, price 0.108

Sent: Monday, April 17, 2017 9:22 AM
Subject: ***** Yuuzoo: Downtrend firm, Price 0.115

Sent: Thursday, April 13, 2017 2:54 PM
Subject: ****** Yuuzoo: Break down seen indeed, cautious, Price 0.117

Sent: Wednesday, April 12, 2017 10:13 AM
Subject: ****** Yuuzoo: Heading dangerously towards 0.120 support again, system? Price 0.121

Sent: Tuesday, March 28, 2017 12:33 PM
Subject: ****** Yuuzoo: Heading towards next support, technical rebound, but cautious of next breakdown, price 0.124

Sent: Wednesday, March 15, 2017 9:41 AM
Subject: ****** Yuuzoo: Heading towards next key support at 0.130, rebound or more selling? Price 0.132

For illustration purpose only


STI : A Quick recap - New breakthrough above 3200 can see the bullishness continue, STI 3228.


Following up from previous blog post on the entire market on 10th Feb 2017 >>> http://singaporetradinginsights.blogspot.sg/2017/02/sti-approaching-key-barrier-for-now-but.html


I mentioned that we were about to attempt a move above the key 3100 level where can see the bullishness continue further... 


Let’s take a look at the chart below that was shown then.


For illustration purpose only


After 2 months has passed, we can see that target has been hit and we have touched the 3200 level yesterday as per the arrows drawn in the above chart.


Finally, with banks leading the charge, we have seen the STI crossed above the key 3200 convincingly yesterday and pulling upwards further today.


As long as STI holds above 3200 now, we can be still in for more upside. 


Moving averages are still looking positive on this move with uptrend intact for the market since the beginning of the year.


What are the next levels to watch for the entire market?


Let’s see where we are on the chart right now.... See below! :)


For illustration purpose only


Tuesday, May 2, 2017

Venture: Some actions caught and a note sent, price 12.81


Just last Friday, we saw some actions above the key 12.00 resistance level in Venture and a note was sent out....


Today, we saw a further push above last week’s high. Was just looking at this counter this morning where I took a screen shot at the chart when it was at 12.47 as seen below.


Mentioned briefly to my inner circle thereafter that we can still see the upside continuing towards 13.00 in the near term....


Now at 12.81.


We may start to see some profit taking after some more strength....


Congrats to those that are riding....


System wise, let’s just say we saw something and it is awesome as of now..... 


PTI grads can check..... J


For illustration purpose only.


--------------------------------------------------------


Recent Emails:

Sent: Friday, April 28, 2017 3:08 PM
Subject: ***** Venture: Pushing higher after some consolidation, price 12.18

Sent: Thursday, April 20, 2017 9:44 AM
Subject: ***** Venture: Uptrend intact, good to hold, price 11.76

Sent: Thursday, April 13, 2017 4:26 PM
Subject: ***** Venture: Pushing past 11.60 can see more upside, price 11.65

Sent: Thursday, March 30, 2017 2:45 PM
Subject: ***** Venture: May test 11.50 soon for more upside, price 11.46

Sent: Tuesday, March 28, 2017 4:20 PM
Subject: ****** Venture: Some actions seen again, uptrend good. Price 11.32

Sent: Thursday, March 02, 2017 5:18 PM
Subject: ******* Venture: A breach above 11.00 level, may push further before profit taking, price 11.13

Sent: Tuesday, February 28, 2017 9:11 AM
Subject: ***** Venture: Target hit and raised on move above 10.50, price 10.54

For illustration purpose only