Showing posts with label RH Petrogas. Show all posts

Tuesday, June 21, 2022

𝐓𝐨𝐩 𝐒𝐢𝐧𝐠𝐚𝐩𝐨𝐫𝐞 𝐎𝐢𝐥 𝐚𝐧𝐝 𝐄𝐧𝐞𝐫𝐠𝐲 𝐒𝐭𝐨𝐜𝐤𝐬 | 𝐑𝐞𝐜𝐞𝐧𝐭 𝐒𝐞𝐥𝐥𝐢𝐧𝐠 𝐀𝐧 𝐎𝐩𝐩𝐨𝐫𝐭𝐮𝐧𝐢𝐭𝐲

The Oil, gas and energy would be one of the best performing sectors in the Singapore stock market since we began 2022.


Many has shifted away from the more interest rate sensitive tech stocks to this sector which became even more bullish when Russia Ukraine war began in February.

However, over the past few weeks it seems like weakness is creeping into this sector too..


So is this just a temporary pull back before the uptrend continues, or do we need to be cautious of more downside..


Joey here, Top Tier Remisier, Trader in Phillip Securities


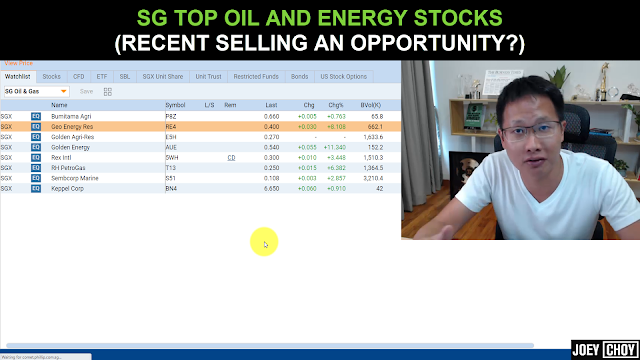
Watch this video all the way to the end as I analyze 4 of the most popular SG Energy stocks that I get asked quite often on.


We will also dive into the 1GT system that I have to see what it says and where we are now..


We actually had a couple of bearish signals coming in before the recent sell down started but are there any exits?


See what i mean...  >> https://youtu.be/Tvpar3cZ0ik


Monday, December 22, 2014

********************* Temp Rebound: RH Petrogas - A series of rebound calls since last week, PRICE NOW 0.415

What do you think? Can it stay above 0.400 now to head higher ?

Sent: Friday, December 19, 2014 9:08 AM
Subject: ********************** Temp Rebound: RH Petrogas - More upside 0.41 still, raise stop loss, price 0.405
As mentioned over the past few days, RH Petrogas has headed higher to the next resistance at 0.41. For those that has entered early, good to also take profit but note that clearing above 0.41 can give way to more upside too. Raise stop loss to 0.395. Support would be at 0.400 currently. Target would then be to 0.46 then 0.50 which was the original support in Oct and November.

Sent: Thursday, December 18, 2014 11:21 AM
Subject: ************* Temp Rebound: RH Petrogas - may be good for a short term technical rebound above 0.35 - 0.355 resistance level, price 0.37
Raise stop loss to 0.345 level. Volume stills seems strong as it pushed above past few days high again. LIKELY to head towards 0.400 resistance level. Let’s see if 0.37 – 0.375 clears out next. As long as 0.35 remains as the new support now, there can be a short term retracement especially for oil and gas counters which has been battered down.

Sent: Tuesday, December 16, 2014 9:24 AM
Subject: ************** Temp Rebound: RH Petrogas - may be good for a short term technical rebound above 0.35 - 0.355 resistance level, price 0.36
RH Petrogas has consolidated about a week below the 0.355 resistance level after the sell down seen and today we have seen some actions again back above the support turned resistance at 0.355. MACD on the verge of crossing over with RSI showing some signs of reversal. AS long as it manages to stay above 0.35 now, can see it trade back up towards 0.39 to 0.41 level. Stop loss at 0.335 for long positions. Note that downtrend is still intact with 20 day MA line still sloping downwards and this could just be a temp retracement.

Monday, October 13, 2014

Tuesday, May 27, 2014

************** Positive Call triggered: RH Petrogas - What a RUN ! Where will it go to now, all time RECENT HIGH AT 0.96 Currently

Clients were alerted of the POTENTIAL Breakout by Email first, followed by an SMS when IT really did Happened “LIVE”.

Click here to Open a Free Trading account ! J to Enjoy LIVE EMAILS AND SMS NOW. Don’t wait further, BE NOTIFIED FAST of any opportunities rather then read the few delayed ones posted here.


Monday, May 19, 2014

REPOST ****************** RH Petrogas: Consolidating upwards above 20 DAY MA support line..... Still a BUY if support holds, Opportunity to accumulate..... NOW 0.66 (NOW AT 0.735)

Following up from previous BUY call to CLIENTS, RH Petrogas has indeed managed to break above the 0.700 critical Resistance last Friday, more upside likely from here on, has hit our initial target at 0.74, possible to head to 0.80 if 0.75 clears too……. Let’s watch !

Were you NOTIFIED by email ?  Email to enquiry@firstratebrokers.com NOW ! OR Click here to Open a Free Trading account ! J

Wednesday, April 2, 2014

******************RH Petrogas: Potential upside on breakout.....0.66 currently ! (FOLLOW UP FROM PREVIOUS CALL)

Following up from previous BUY call made last week (see below email to clients).
RH Petrogas has indeed cleared above the 0.65 resistance level yesterday on closing and traded higher to a high of 0.67 today. More upside can be likely as long as 0.65 remains as new support. Target to 0.700 then 0.800. Resistance has been holding since Jan this year and finally cleared yesterday, let’s watch to see if supported well.
Stop loss at 0.635
 
 
Sent: Monday, March 24, 2014 9:51 AM
Subject: *************** Potential Upside: RH Petrogas. Share price 0.63. (Breakout above 0.65 possible, watch ! )
RH Petrogas has staged a strong rebound after breaking above the 0.55 temp resistance last week, currently likely to test the 0.65 resistance level in the next few days. This was the high set in Jan before it dipped which makes it a barrier to watch. Any upside breakout above this 0.65 level can see it head to 0.70 to 0.80 target. Monitor closely or this potential trade setup.
Stop loss at 0.62
 

Thursday, February 20, 2014

********* Trading BUY: RH Petrogas. Broke 0.56 resistance..... NOW AT 0.57


Sent: Thursday, February 20, 2014 3:46 PM
Subject: ********* Trading BUY: RH Petrogas. Broke 0.56 resistance..... NOW AT 0.57
 
Has cleared the 0.56 IMMEDIATE resistance on Top 30 volume today, something brewing ?  Tested 5 times over the past 3 weeks and finally manage to clear above today. Next target to 0.600 the 0.65.. 0.56 resistance level also coincides with the 20 day short term MA.
Stop loss at 0.545
 

Tuesday, January 7, 2014

********* Monitor Closely for Breakout: RH Petrogas. Share price 0.63.

Rh Petrogas is currently testing the immediate support turned resistance at 0.63, 0.635. A break above 0.635 can see more upside to 0.65 then 0.700. Ascending Triangle pattern seen since mid Nov 2013 with resistance at 0.63. Volume still relatively low at the moment but a breakout on high volume might see momentum taking it higher.
Stop loss 0.595.