Friday, December 27, 2019

Bumitama Agri: Still pushing higher as per revised targets? Price 0.78


About a month back, we saw Bumitama Agri attempting to break the 0.70 resistance level…


That was also where the downward sloping channel resistance was, so any move up above that price level can be a good reversal signal


Upside target was drawn towards 0.75 first as seen below..


From the moving averages, a longer term uptrend reversal still needed more confirmation,


but the short term uptrend was looking quite bullish with it trying to find a new high and with 20 day MA reversing up, crossing above the longer term MAs fast..


See below chart what was seen then..


Over the next few weeks, we started to see it pushing higher toward our first target that was finally hit at 0.75.


Some profit taking set in which is normal given the 6% gain in a few days..


Upside target was reiterated again towards 0.85 if we do see more bullish actions above this critical price level from 0.75 – 0.76…


See below target..


Trend indicators were still looking favorable though some consolidation expected after the run…


Fast forward to today,


We managed to see some consolidation as mentioned below 0.76 over the past 2 weeks..


Sellers seems to be defending this level and buyers were just not ready to take it up further..


Target as drawn previously was still intact as seen above and just waiting for the move…


Today, FINALLY, we managed to see some bullish price actions returning, with a firm move above the 0.76 level..


See below chart where we are today now…


Some short term upside still good to go where we may attempt to break the 0.80 level to push towards 0.85 as per target..


Watching…


Want to get ideas like these by WhatsApp as it happens?


Open a free trading account with Joey and his team here, find out why >>>  http://bit.ly/BeJoeysClient


Friday, December 20, 2019

UOL: The start of its Uptrend continuing? Price 8.23. Looking bullish!


Just last month, we saw UOL approaching the key 8.00 resistance..


This was definitely a key level to watch as we have been trading below this level since June 2018 and so far buyers have not been able to break upwards…


There were already some signs of the uptrend taking shape from the trend indicators so was expecting a bullish move soon..


Just not so sure how soon..


But if we spot any bullish price actions above here, it can be a good signal..


So this counter was definitely in my watchlist for more upside..


Targets were drawn as seen below to 9.00 first…


Over the next few weeks, we have indeed broken the 8.00 but unfortunately, there was some consolidation again with it trading back to 7.60..


Sellers were out to take it lower on profit taking and also on some market weakness… however,


Some good support came back over the past few weeks at 7.70 and we were back to test the 8.10 level again..


Moving averages were looking good still despite the profit taking earlier…


Targets were reiterated with a potential move up again, see below..


Over the past few days, seems like we are seeing an attempt to push higher again…


Targets are reiterated as per below where the uptrend can continue…


It may be heading towards 8.50 – 8.60 first where there can be some profit taking along the way…


Finally some bullish actions returning after more than a year..


Watching to see how far this reversal can go…


See below where we are now…


Want to get ideas like these by WhatsApp as it happens?


Open a free trading account with Joey and his team here, find out why >>>  http://bit.ly/BeJoeysClient


Friday, December 13, 2019

UMS: Uptrend still going strong? Price 1.01. A recap from previous Blog post!


We actually covered this counter on my blog more than a month back when it was around 0.855..


Back then, we had rallied all the way from 0.70 in late Oct 2019 and,


we were facing some obstacles when we approached the temp 0.86 resistance,


There was a slight retracement back to 0.80 as a result..


However, buyers were out to defend the 0.800 support level and a rebound was caught


Our upside target was revised further on this rebound as seen below..


To 0.90 first then ultimately to 1.00..


There were still signs of the uptrend going strong from indicators..


In a few days, we managed to break above the 0.900 psychological resistance and buyers took a breather..


It started to consolidate from 0.90 to 0.95 for about 2 weeks but the 0.90 support was holding strongly..


Again, with this level holding, upside targets were reiterated to 1.00 and even to 1.10..


See what I mean below…


That was even before any more was seen.


Price were holding firmly above the 20 day moving average which was one of the signal we use to gauge short term strength..


See where we were then, somewhere around 0.92…


More bullish actions followed subsequently as per targets over the past week…


We managed to hit our critical target at 1.00 a few days back and then some profit taking happened..


However, seems like we are seeing an attempt to break this level to push higher..


On more bullish price actions spotted, we can see the uptrend continue so this counter is definitely still in my watchlist for that,


For now, let’s see if we can hold above the 1.00 new support. Sellers seems to be still here to hold off any up ticks FOR NOW..


Watching, more upside not ruled out !! see below chart where we are now!


Want to get ideas like these by WhatsApp as it happens?


Open a free trading account with Joey and his team here, find out why >>>  http://bit.ly/BeJoeysClient


Friday, December 6, 2019

ManulifeReit USD: Quite a good run. Is the upside over? Price 1.00


Just a month ago, we saw some pretty bullish reversal actions in this counter ManulifeReit USD…

It has been trading  below this 0.92 resistance level for about 2 months and buyers were just not able to break through..

However, the move finally came somewhere around 8 Nov 2019…

The uptrend indicators were also looking positive then and more short term upside was expected..

Hence some targets were drawn as seen below.

Towards 0.98 first where we would expect some profit taking..


A few days later, we started seeing prices pushing higher towards target..

From 0.95 to 0.96 then, to just last week when it was nearing our 0.98 target finally..

The uptrend looks good and target were revised higher on the potential break of the 0.98 resistance last week as seen below..

We were expecting buyers to test this level and break through.. see what I mean.. before it happened…


Fast forward to today, we have indeed broke then 0.98 resistance..

In fact, the 1.00 resistance is key for now as we are attempting to clear it..

Any firm bullish actions above can start to see the uptrend continue towards our higher revised target, watching..

Perhaps to 1.05 -1 .10 next… let’s see..

Quite a good run over the past 1 month… more upside to come?

Click here to open a trading account with Joey and his team >> http://bit.ly/BeJoeysClient


if you would like to received first hand ideas through WhatsApp.. (Instead of delayed blog ideas)


Monday, December 2, 2019

AEM: Attempting to push higher? Price 1.88. Uptrend may not be over.


Just about 3 weeks back, AEM was on a bull run, it breached the 1.60 resistance….


And also the 1.70 level gave way too..


FYI, we had covered this specific counter end of Oct too in this previous blog post when it was around 1.45 >> http://singaporetradinginsights.blogspot.com/2019/10/aem-quite-good-spike-caught-then-some.html


2 weeks later, it started pushing higher..


Our target was revised higher to 1.90 as seen below… that was the key resistance we had been trading below since early 2018, and it was key


Short term trend indicators were also looking good then.. see what I mean,


Over the next few days, indeed we approached the 1.90 key resistance and some heavy profit taking returned..


It started to retrace lower towards 1.70 where we were seeing some good support..


It was likely to consolidate from 1.70 to 1.90 before more actions,


And we were expecting buyers to start coming back near 1.70 for any potential rebound


A rebound towards 1.90 where there can be another attempt above that key resistance…


See targets that we revised from the 1.70 level up..


Fast forwards to now, we have started to see some bullish actions again over the past few days..


A firm and bullish rebound from the 1.70 support last Friday..


And today, it is approaching the 1.90 again


Some selling is coming back…


But we are awaiting more bullish price actions for the next phase of uptrend to continue…


So far, not yet…


But definitely, this counter is in our watching list for more upside..


Profit taking near 1.90 normal for now…


Huge sellers stacked there but let’s see when they can be cleared… watching.. See where we are below…


Monday, November 25, 2019

Valuetronics: Quite a good run over the past 2 weeks! Uptrend still good? Price 0.77


Just about 2 weeks back, we spotted Valuetronics approaching the 0.70 resistance level…


It has been trading below this level since March this year so any bullish move above can be something interesting..


All this while, it has been consolidating from 0.60 to 0.70 and not much of a direction but 2 weeks back,


We started seeing something interesting


Buyers seems to be willing to break the key resistance and short term moving averages also were looking positive..


Hence some target were drawn to 0.85 as seen….


Indeed, we started to push higher over the next few days and tested the 0.80 resistance too..


Went to a high of 0.81 before some profit taking…


Looking at a 12.5% gain from when first covered around 0.70 so any profit taking is normal..


Sellers were out to defend this 0.800 level which is where it is consolidating below for now…


Over the past week, we are seeing it trade back down towards 0.75 – 0.76 which was the resistance it broke up from too..


This is likely the support for now with buyers keen to defend this level as seen from the candles..


Might continue to consolidate from 0.75 to 0.80 for the time being before we see more direction..


Meanwhile, trend indicators are still slowly shaping out to be more bullish…


Will be monitoring for more bullish price actions at 0.80 to see our target at 0.85 on tracked..


Tuesday, November 19, 2019

Frencken: A huge rally over the past 2 weeks but is the uptrend over? Price 0.935.


Just about 2 weeks back, we saw Frencken approaching the KEY 0.75 resistance bullishly..


Since July this year, we have headed towards it but each time met with heavy selling and then a sell down back towards 0.60..


All this while, the long term uptrend seems to be holding well despite the short term weakness and profit taking…


So when we started to approach 0.75 again 2 weeks back, it was an alert for a potential move up..


I was looking for more bullish price actions at the level to lead the next phase of upside..


Definitely on my watch list with some targets drawn before anything happened with first target at 0.90,


See what I mean below…


Over the next few day, the move indeed came!


It was FAST!


Buyers just lifted off the entire sellers and within a week it has hit our target at 0.90..


Target was reiterated upwards to 1.00 as it happened last week too, see where we were then..


Was quite a good spike up with it forming higher highs each day and uptrend was firm…


Fast forwards to today, just wanted to do a quick analysis again..


Seems like we are seeing some support at 0.90 over the past few days with buyers defending this level..


It is likely taking a breather with it consolidating from 0.90 to 0.95 before more direction..


This is normal given the huge rally we have seen.


With 0.90 holding as the support for now, more upside can still be possible towards 1.00 and higher as per revised target below..


However, given the spike we have seen over the past 2 weeks,


would want to have a strict stop loss to protect profits at all cost  😉


Quite a good move up indeed…. Uptrend still looks good above 0.90 imo… watching to see when it can push again..


Wednesday, November 13, 2019

Penguin: Pushing higher over the past 2 months. Can there be more upside from here? Price 0.71


Just about 2 months back, we saw Penguin breaking the key 0.56 resistance level..


We had been trading below that level for about 4 months so any bullish move above could be a good signal of more upside to come..


Buyers managed to defend that level and it became a good support base for them to push higher..


Indicators were also pointing towards an uptrend taking shape nicely for this counter..


Hence, some target were drawn as seen below, to 0.65 first… see what I mean,


In about 2 week, we started pushing higher and target at 0.65 was nearing..


Target was reiterated again to 0.70 with the uptrend still intact..


There were some profit taking along the way but buyers were still holding well and not allowing price to push lower to where it was the previous week…


We call this forming higher highs daily which is a good sign of strength and momentum.


Short term moving averages were also bullish..


Fast forward to where we are now, we have seen some slight consolidation below 0.700 resistance over the past 3 weeks..


Support was shifted higher at 0.65 and that’s where it held on well..


The thing is, we have been awaiting further upside with a potential breakout above the 0.70 for the uptrend to continue..


Seems like we are seeing some bullish actions returning again over the past few days…


Which can see price pushing higher…


Looking at another 12% gain from new revised target at 0.80 now..


Quite a good run over the past 2 months indeed, but is it over?


Remains to be seen, but for now, looking good with it holding above 0.70 support… See where we are now…


Thursday, November 7, 2019

UMS: A decent upside reversal caught! Price 0.855. Is it over?


Just about 2 weeks back, we saw UMS heading towards the 0.700 psychological resistance level…


It had been trading below this key resistance for about 5 months so any move towards it bullishly will be something to note.


Our alerts were set and we were expecting some potential move up but just not sure when..


There were also some signs of the uptrend starting to form up and hence some targets were drawn…


That firm bullish move indeed came on 24th Oct 2019.. and targets were reiterated as seen…


All the way to 0.80 first…


Over the past week, we have seen our first target at 0.80 hit and there were some profit taking…


This is normal given the spike up we have seen.


But eventually, we managed to get pass 0.80 too and 2nd target to 0.90 was on tracked..


It then tried to hold above the new 0.80 support last week and target were reiterated as seen below…


Buyers were seen coming out on dips near 0.80…


Over the past few days, we have pushed higher, breaking temp 0.85 resistance as well..


Seems like it is taking a breather for now as we near the 0.90 firm resistance…


Still in watch list for now as we see if we can attempt a move above 0.90


Any bullish price actions spotted may give way to the next phase but for now, some consolidation expected with profit taking near 0.90…


Watching..


See where we are below….


Monday, November 4, 2019

Rex Intl: A good rebound caught! Price 0.113. Some upside possible before consolidation again.


Just 2 weeks back, we saw Rex Intl approaching the key 0.100 resistance cautiously..


This level was definitely one to watch as we had been consolidating below this level for more than a year..


Any firm bullish price actions near it would be very interesting for further upside to continue..


More importantly, there were also some signs of strength from the trend indicators as we head towards 0.100,


Hence, a potential break out was expected and targets drawn,


See what I mean below..


All the way to 0.120 which was another key resistance to watch… Looking at about 18.1 % gain from this target as seen from the chart below..


The firm bullish move indeed came last week after some profit taking near 0.100…


Sellers were out to take profit and hold down prices initially but they just could not hold on any longer when buyers just cleared out the levels from 0.100 – 0.103 fast..


Targets were reiterated again as it happen last week…


All the way to 0.120…


There was still some room to go for the upside though we may experience some slight profit taking along the way, near 0.110…


Over the past few days, we have broken the 0.110 temp resistance as well…


Looks set to head towards 0.120 where some good selling can return again..


Would be good for those who have rode the upside to protect any profits…


and also look to book profit as it approaches 0.120


Quite a good run seen and may still be playing out per current prices based on target drawn 2 weeks back… watching!


Wednesday, October 30, 2019

AEM: Quite a good spike caught then some profit taking. Price 1.45. Uptrend may not be over...


Just about 2 weeks back, we spotted AEM approaching the key 1.30 resistance level…


This level was key has it has been trading below since May last year and buyers were just not able to lift it off..


Tested for close to 4 times but failed always..


But this time, it was different, there were some signs of the uptrend starting to take shape as it approach the 1.30 resistance.


Hence, some upside targets were drawn with a potential break out expected…


See what I mean below..


Early last week, the bullish move that we were waiting eagerly for indeed came,


It was attempting to break the 1.30 level and buyers were ready to push it higher..


Some bullish price actions was spotted as it happened and upside target reiterated as seen below.


You can see that after 1.30, there was quite a huge gap to clear and hence quite a good reward to risk ratio for any long position to be taken.


The reversal to the upside looks set to continue as per our targets..


Over the past few days, the 1.40 resistance gave way too,


And we have managed to push higher to a high of around 1.53 before some profit taking came back..


This is normal given that we have surged from 1.30 all the way to more than 1.50 in a few days which is more than 14% gain.


For now, likely to see some support coming back from 1.40 where it may consolidate above before attempting to push towards 1.60 target as drawn…


The uptrend still looks good if it holds above 1.40 now and there may be more legs to the rally after a rest..


Still in our watch list…


Wednesday, October 23, 2019

CityDev: A bullish move finally seen as predicted. More upside from here? Price 10.67.


Just about 2 weeks back, we saw CityDev approaching the key 10.00 resistance level


It had been trading below this level for more than a year with it testing it for more than 2 times but failed to get above..


This time, it was nearing it again after some consolidation above 9.50 for a few weeks..


More importantly, there were already signs of the uptrend starting to take shape from indicators,


Hence, a potential move up was expected and some targets were drawn… it was then around 9.77.


Target was to 11.00 first,


See what I mean below.


Last week, true enough, the move came..


It was pretty fast with buyers just coming in to clear out all sellers at 10.00,


And it just started rising fast.. Uptrend was looking good on this move..


Targets were again reiterated towards 11.00 first and maybe even higher where a 2nd target is drawn..


Was quite a bullish move up after the consolidation below 10.00 for more than a year as mentioned…


Over the past few days, we have seen the temp 10.50 resistance gave way too and with CityDev pushing higher…


Likely to see some profit taking as it nears 11.00 for now,


But uptrend may not be above if it can hold above 10.50 higher support..


Indicators still pointing towards more upside for now..


Watching to see if target can be hit, but quite a good run seen..


Friday, October 18, 2019

Mapletree Ind Trust: Is the uptrend over? I doubt so for now.... Rebound caught! Price 2.59


Slightly more than 2 weeks back, we saw Mapletree Ind Trust selling down towards it key 2.40 support..


This level was crucial as it was the resistance it actually broke above last month…


It had then traded all the way to near 2.60 before some heavy profit taking…


So when it traded back to this 2.40, this could be where buyers may be looking to bargain hunt  again…


In addition, it also coincides with the 20 days moving averages which lends some support..


Hence, expecting the uptrend to continue further, some upside rebound targets were drawn back towards 2.60


See what I mean…


Over the past 2 weeks, we have indeed seen the rebound off the 2.40 support level taking place…


Buyers came back bit by bit and regained control again as prices pushed away from 2.40…


It broke the 2.50 over the past few days, approaching the 2.60 target as drawn…


We may see some profit taking near here again given the rebound over the past 2 weeks but..


Awaiting more bullish actions above 2.60 which can see the uptrend continue…


Looking at a really good firm uptrend for now based on trend indicators…


Monday, October 14, 2019

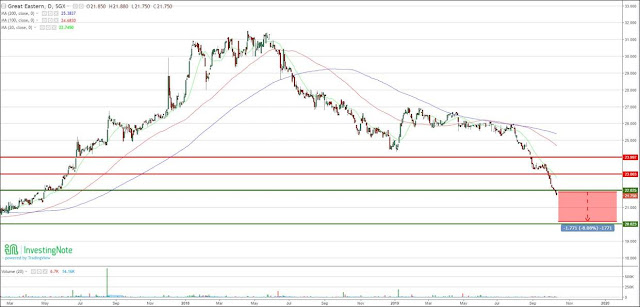
Great Eastern: Downtrend to continue for shorts? Sellers still seems to be in charged! Price 21.75


Just 3 weeks back, we spotted Great Eastern approaching the KEY 23.00 support dangerously


It has been pushing lower after each consolidation since August and hence there were definitely some signs of weakness


In fact, trend indicators were also pointing to more downside


Some downside targets were drawn with a potential break down of 23.00 expected eventually..


See what I mean below…


Buyers seems like that were not able to hold any longer and sellers were attempting to regain control again..


Over the next few days after spotting, indeed, the break down occurred at 23.00 and sellers took price lower…


Target were again reiterated with a sell down towards 22.00 expected next…


That was the next crucial support based on prices 2 year back where it held,


And this is also where we may start to see some short covering.


Downtrend was intact on this move down…


Last week, we traded lower towards 22.00 and seems like this support has given way as well..


Which opens up the way to our next target towards the psychological 20.00 as drawn all along..


With price holding below 22.00 now, still looks bearish and sellers can continue to push lower after a slight breather…


For those who have taken shorts earlier, would be good to start protecting profits while riding further…


More for CFD Shorts to profit from the downside rather that just holding on blindly to long positions..


Will be looking to see when target at 20.00 can be hit eventually…..


Wednesday, October 9, 2019

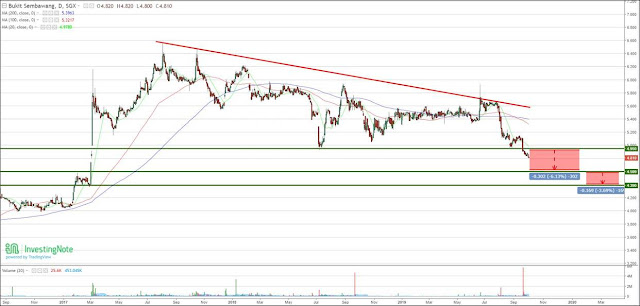
Bukit Sembawang: Selling still not stopping? To ride downside further.... Price 4.76.


Just about 2 weeks back, we spotted Bukit Sembawang heading towards the key 4.95 – 5.00 support level..


This level was definitely one to watch as we have been holding above for more than 2 years and..


We have rebounded from it about 3 times..


But this time, things seem to be different with some signs of weakness creeping in.


From the trend indicators, some downside was also starting to show….


And hence some targets were drawn for a potential breakdown… see what I mean…


First target to 4.60 first…


Last week, more selling came and buyers were just not able to hold above the support at 4.95 as mentioned earlier…


Sellers managed to regain control and were ready to take prices lower..


Managed to see selling all the way to 4.80 where there were some slight support…


But downside targets were again reiterated, to 4.60 then even lower to 4.40 if that fails to hold too..


Over the past few days, seems like 4.80 is not holding either….


More downside possible from here…


Hope that no one is holding on to long positions… More for shorts with CFD to ride further weakness while protecting profits…


See where we are below and targets drawn which can still play out…


Friday, October 4, 2019

BreadTalk: Sellers still not letting go? Price 0.595. Downtrend firm for now...


Just about a month ago, we saw more weakness in BreakTalk with it heading towards the next support at 0.63..


This level was key as we had seen support above here more than 2 years back in 2017..


Buyers were likely to come back for some short covering,


However, more downside was still possible, especially with the downtrend indicators pointing firmly to more selling…


Hence, targets were reiterated to the downside with a potential breakdown below this 0.63 level expected…


See what I mean below…


2 weeks passed and indeed, the 0.63 support gave way,


Buyers were just not able to hold any longer as expected…


Targets were reiterated again all the way towards 0.50 with some temp support at about 0.55..


Sellers seem to be willing to push even lower towards target….


There were some consolidation above 0.60 but short term downtrend can continue imo with indicators still bearish…


Fast forward and over the past few days, we have seen the 0.60 psychological support broken too…


We can expect more selling towards target with downtrend intact


Definitely would not want to be holding on to this counter blindly for now.. More for CFD shorts to ride further weakness…


Not too sure how low it can go, but so far, we have seen more weakness after some slight consolidation,


Forming lower lows as a result which is not a good sign


Let’s see when downside targets can be hit… maybe soon?