Friday, February 27, 2015

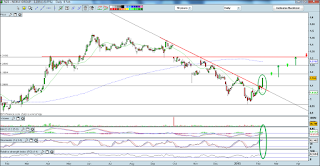
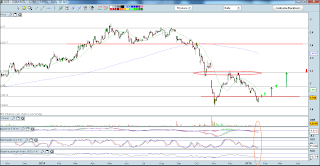
Bearish Setup: Yoma - a couple of CFD SELL calls to ride the downside..... still heading downhill ?

Getting weaker by the day as it breaches a new low….. where to now? Be our client to find out and many more.  J


Sent: Thursday, February 26, 2015 9:44 AM
Subject: **************** Bearish Setup: Yoma - further breaking 0.465- 0.47 support can lead to more downside.... price 0.47 - CFD SELL
As per previous few sell calls, YOMA has consolidated about a week from 0.47 to 0.50 range and today we have seen an attempt to further break the immediate support again. Clearing of 0.465 levels can be a confirmation. As long as 0.500 is a resistance, still a negative and CFD sell positions can be used to ride the downside further. Target to 0.45 then 0.40 on a clear breakdown.


Sent: Monday, February 16, 2015 10:29 AM
Subject: ***************** Bearish Setup: Yoma - Breaking below 0.50 - 0.51 support can lead to more downside.... price 0.48 - CFD SELL
Yes, has broken the 0.500 support level convincingly today further. Note that as long as 0.500 is a resistance, this counter still looks weak in the short term. CFD SELL to ride any downside with Buy stop loss at 0.515. May see it trade to 0.45 first then 0.40.

Wednesday, February 25, 2015

OKH Global - Breakout indeed spotted today above 0.625, more upside?

Can it hit out target at 0.700 eventually? Were you informed yesterday afternoon ?

Sent: Tuesday, February 24, 2015 12:00 PM
Subject: ******************* Potential Breakout: OKH Global - Next resistance at 0.625, KIV.... Price 0.615
OKH Global has broken above the 0.58 immediate resistance level over the past 2 day on stronger volume and pushing towards the critical 0.625 resistance level. Have been consolidating below 0.625 for the whole of last year so any clearing above can be considered a positive whereby a new upwards phase can begin. Both Stochastic and RSI indicator looking positive at the moment but more confirmation needed on horizontal price level.

Tuesday, February 24, 2015

Innovalues - Breaking towards a new high as mentioned last week to clients!

Has indeed staged a convincing breakout as per last Tuesday’s call and has even closed above out first target at 0.605 today. What do you think, still good to go?

Sent: Tuesday, February 17, 2015 9:23 AM
Subject: ****************** Consolidation before more actions: Innovalues -next resistance at 0.56 critical which is also today's high, price 0.555
Seems like 0.56 resistance still holding for now. Note that any lifting of this level can be a positive to 0.60 then 0.64 on strong volume, Raise stop loss to 0.545 on a  further breakout and continue to ride the upside.  J 20 day MA still pointing upwards firmly and immediate support would be at 0.54 for now.

Sent: Tuesday, February 03, 2015 10:12 AM
Subject: ******************* Consolidation before more actions: Innovalues - Staying above 0.500 will still be a positive, price 0.545
Following up from previous breakout BUY CALL, Innovalue has traded higher to touch a high of 0.56 over the past few days. Breaking a new high each day on strength with above average volume is a positive sign.  Range would now be from 0.52 to 0.56 first for a brief consolidation before more upside again of it manages to clear above the 0.56 temp resistance level. Any further breakout can see it trade to 0.60 then 0.64 in the near term. All 3 technical indicators still looking positive and trending upwards with no end to uptrend in the mid to long term in sight. 200 DAY ma line still gradually sloping upwards. Can continue to ride the uptrend while raising stop loss.

Vard- Breakout above immediate resistance after slight consolidation

Can it cross above 0.600 psychological resistance now as mentioned this morning? Now at 0.595

Sent: Tuesday, February 24, 2015 9:16 AM
Subject: ****************** Vard- Breakout above immediate resistance after slight consolidation, price 0.58
Vard has formed a new high today on top 5 volume as it breaks above the 0.575 two weeks consolidation resistance. Seems like heading towards the 0.600 level. Any breakout above there can again pave the way to 0.64 in the short term. 20 DAY MA Line finally looking at a reversal and pointing upwards after trending downwards since June last year, raise stop loss to 0.59 on a further breakout above 0.600. J

Sino Grandness - What a run after breakout spotted this morning at 11.02am?

Now at 0.47, can it hit our first target at 0.500 ? Be a client to be notified LIVE in future of any trading opportunities!
Sent: Tuesday, February 24, 2015 11:02 AM
Subject: *********************** Sino Grandness - Rebound setup possible above 0.44 new support level, price 0.445
Sino Grandness has traded below the 0.435 temp resistance level for about a week after retracing downwards from a high of 0.55 in Jan. Today, we have seen some actions again above the 0.44 resistance level which can lead to a recovery back to 0.50 then 0.55 in the short to midterm. Indicators looking oversold at the moment. As long as 0.435 – 0.44 is a new support, upside rebound likely, with stop loss at 0.42 envertheless. Has been consolidating sideways below 0.55 key resistance since October and may trade back to test this level again.

Monday, February 23, 2015

Suntec Reit: Stock to watch ! price 1.96

Hit a high of 1.97 today before pulling back… let’s watch !

Sent: Wednesday, February 18, 2015 9:23 AM
Subject: **************** Suntec Reit: Potential Rebound - Consolidation in progress, may be a good opportunity to accumulate above 1.90, price 1.92
Following up from prevous call, Suntec Reit has been trading from the 1.90 to 1.935 resistance level and seems to be holding above 1.90 psychological support well. Any breakout above 1.935 – 1.94 resistance on strong volume can pave the way back to 2.00 – 2.01. As long as 1.90 holds as the immediate support, still good for any rebound. Next support would be at 1.86. 20 DAY MA line also coincides with current 1.935 resistance so crossing above this level can end the current consolidation phase. Watchlist ! Stochastic indicator starting to trend upwards as it consolidates higher each day. Need more confirmation on break above horizontal level.

Genting SP - Breaking above 1.05 today as mentioned to clients last Wednesday !!

Breakout indeed occurred today on top 10 volume. Can it hold above 1.05 now ?
Sent: Wednesday, February 18, 2015 9:14 AM
Subject: ************************ Genting SP - Consolidation in wait of more direction, price 1.04, levels to note....
Genting SP has been trading in the range of 1.02 to 1.045 for more than a week already since our previous call. Immediate resistance stands at 1.045 for now after which would be at 1.085 which has been resisting since December. Stochastic indicators look oversold with signs of a bullish crossover leading to a reversal back up. Any breakout above 1.045 – 1.05 can see it trade back up to 1.085 first. Apart from that, as long as 1.00 holds as the support, there can be room for a rebound from current levels too, take note of the price levels. Those looking to accumulate on dips can do so if 1.02 support does not hold and accumulate near 1.00 support for a potential rebound.


Sent: Thursday, February 12, 2015 9:37 AM
Subject: **************** Genting SP: Nearing 1.00 support level, Rebound or breakdown. Trade it either way.... price 1.02
Genting SP trading range is currently from 1.02 to 1.05. Has been trading lower for about 2 weeks already after it not being above to cross above the 1.085 resistance level. A break below 1.02 temp support can see it trade back to the critical 1.00 psychological support level which has been holding for about 4 months already since October. Those looking to accumualte for any rebound like we have seen for about 4 times can consider buying on dips near 1.00 support leveL. As long as this level holds in the short to mid term ,there can still be a rebound opportunity. However, note that a clear breakdown below 1.00 can put an end to the consolidation phase and we may see more downside to 0.96 then 0.90. So stop loss at 0.985 for any long positions. CFD sell on a convincing breakdown below 1.00.

Tuesday, February 17, 2015

Bearish Setup: Yoma - did break below the 0.500 support as mentioned last week, more downside ?

Sent: Friday, February 13, 2015 3:05 PM
Subject: ****************** Bearish Setup: Yoma - Breaking below 0.50 - 0.51 support can lead to more downside.... price 0.500 - CFD SELL
Yoma has traded above the 0.51 level since Nov 2012 and recently has also consolidated above it for about 3 weeks. Today we have seen it break below the 0.51 support on strong volume and this can open the way to more downside to 0.45 then 0.40 20 DAY MA line has been accelerating downwards since last month and downtrend looks to be still intact especially if it stays below 0.500 new resistance now. CFD SELL positions to ride any downside can be possible with BUY STOP loss at 0.525.

Valuetronics: Can it head higher upon crossing above 0.41 resistance now ?

Sent: Monday, February 16, 2015 11:40 AM
Subject: ************************ Valuetronics: Breaking above 0.40 - 0.41 a positive, short term Trading setup
Valuetronics has broke above the temp resistance at 0.41 on TOP 20 VOLUME which it has traded below since September. There can be more upside to 0.45 then 0.48 as long as 0.40 remains as the new support level now. A potential Bullish Double bottom pattern seen with 20 DAY MA line also finally reversing upwards. Horizontal level at 0.40 – 0.41 critical for more upside. Stop loss at 0.39 for long positions.
Sent: Tuesday, December 30, 2014 9:56 AM
Subject: ************************ Valuetronics: Temp retracement possible above 0.36 resistance. price 0.355
Valuetronics has been consolidating below 0.355 for about 2 weeks and have found a support around the 0.34 level. There can be a temp rebound if it can cross back above 0.36 which is also the 20 day MA line. Stochastic and RSI looks oversold and looking at a possible reversal if horizontal resistance clears out too. Short term target to 0.40 then 0.44. Stop loss at 0.335. Watchlist first.

Monday, February 16, 2015

Series of BUY Trading Calls on SingTel. - With one even mentioned on 938 Live last Friday Evening, where to now ?

Clients were alerted to SINGTEL last Friday Morning at 9.41am. Followed by a mention on 938 LIVE interview as one of Joey’s Stock Picks after the trading session ended.

Today, we have indeed seen it trade to a high at 4.30 as mentioned on Radio 938 Live.  CLICK HERE for Full audio and TRANSCRIPT. Be a client to not miss out !  ;)


Sent: Friday, February 13, 2015 9:41 AM
Subject: ****************** Potential Upside on New High: Singtel - Testing 4.20 resistance now on Strong results, price 4.20...
Singtel has headed to a new high of 4.22 today on the back of results topping expectations. From previous call, it has managed to stay above the support at 4.10 and has consolidated below 4.16 for about 2 weeks before some reactions yesterday. Any clear breakout above 4.20 psychological resistance would be a signal of more strength and it can head towards 4.30 in the short to midterm May need to hold to ride any upside and for yield.


Sent: Friday, January 30, 2015 9:51 AM
Subject: ******************* Potential Upside on New High: Singtel - Broke 4.10 resistance, price 4.11...
Singtel has broke above the 4.10 high set in May 2013 on strong volume today. It is currently at a new high and this can lead to more strength in the coming days. AS LONG AS 4.10 HOLDs as the new support, it can surge higher before consolidating again. Technical indicators all still looking positive with room to go. Support would be at 4.10 then 4.00 currently.

Friday, February 13, 2015

**************** Noble Group: A Series of BUY CALLs with one this morning too, NOW AT 1.205.

Can it stay above 1.20 now ?


Sent: Monday, February 09, 2015 9:21 AM
Subject: **************** Noble Group: Heading towards next 1.20 psychological resistance, What a breakout seen.... price 1.165
From previous Buy call on Friday, Noble seems like heading towards the next resistance at 1.185 – 1.20 level. For those who managed to get in on time, can also consider taking profit as it may dip slightly and consolidate before heading higher on the break above 1.20 again which can see it trade back up to 1.25 then 1.32. Have pulled away from the channel resistance line that it has broke above clearly on Friday on top volume and hitting a new recent high again today on momentum. Indicators looks positive and trending upwards on Friday’s price action. Immediate support can be at 1.15 for now. Raise stop loss to 1.145 to protect profit if not sold.

********************** Bearish Setup: Ausgroup - Break downof support seen, Price 0.29 - CFD SELL

Sent: Tuesday, February 10, 2015 9:29 AM
Subject: *********************** Bearish Setup: Ausgroup - Break downof support seen, Price 0.29 - CFD SELL
Ausgroup has been trading sideways forming lower highs since November last year above it horizontal support level at 0.295. Overall downtrend still look intact with it trading below the broader channel support line since April. Bearish DESCENDING Triangle spotted which can see more downside to 0.26 then 0.23 in the near term if it stays below 0.295 now. 20 day MA line have been sloping downwards gently with no reversal insight yet. CFD SELL to ride any downside along the way !

************** Bearish Setup: China Env - Breaking down below 0.200 support, not good, CFD SELL

Sent: Thursday, February 12, 2015 9:44 AM
Subject: ****************** Bearish Setup: China Env - Breaking down below 0.200 support, not good, CFD SELL
As long as 0.200 remains as the new resistance level, can see it retrace back down to 0.180 then 0.150 support level. CFD SELL positions can be used to ride any downside. All 3 technical indicators looks to be turning downwards after the upticks seen since December. It has also just broken below the 20 day MA line and has continued to stay below for about a week. Careful long positions. Have broke below the 0.200 support level today on top 20 volume.

Thursday, February 12, 2015

**************** Ezion: Breaking below 1.20 on weaker OIL prices.... Downside possible below 1.20... price 1.19

Sent: Wednesday, 11 February, 2015 11:18 AM
Subject: ****************** Ezion: Breaking below 1.20 on weaker OIL prices.... Downside possible below 1.20... price 1.19
Ezion has broke below the psychological 1.20 support which as holding for about 3 weeks today with 20 day MA line finally looking at a reversal downwards. As long as 1.20 is a resistance there can still be more weakness specially if oil price retraced further. TARGET CAN be to 1.14 then 1.10. Stochastic and RSI indicator reversing downwards after the upward movement seen OVER THE past 2 months. Careful long positions. CFD SELL to ride any downside possible.

Monday, February 9, 2015

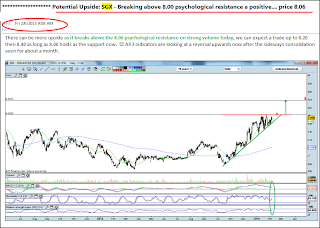
***************** Potential Upside: SGX - Breaking above 8.00 psychological resistance a positive.... price 8.06 (NOW 8.14)

STILL GOOD TO GO ?

************* Noble Group: BREAKOUT seen Strongly on Friday as Mentioned over the past few calls !!!!

Sent: Friday, February 06, 2015 9:14 AM
Subject: **************** Noble Group: Rebounding gradually, 1.10 resistance critical.... price 1.105
Let’s see if sellers at 1.11 clear out as well, if this happen, can be a short term bullish trade setup with target to 1.14 first. Volume at TOP 2 currently as it attempts a breakout above 1.10 for the  4th time within a week. Kiv

Sent: Tuesday, February 03, 2015 11:39 AM
Subject: ***************** Noble Group: Rebounding gradually, 1.10 resistance critical.... price 1.09
Volume remains strong today as it attempts a breakout above 1.10 as mentioned yesterday. However, still not able to cross above convincingly. May consolidate from 1.06 to 1.10 first before attempting again. Clearing of 1.105 – 1.11 will be a good confirmation of more upside to 1.14 first. Watchlist still !

Sent: Monday, February 02, 2015 4:20 PM
Subject: ***************** Noble Group: Rebounding gradually, 1.10 resistance critical.... price 1.08
Noble range likely from 1.06 to 1.10 for now. Has been trading upwards forming a new high each trading day as it attempts to near the 1.10 psychological resistance level again. Note that any breakout above the 1.10 resistance can open the way higher to 1.14 THEN 1.18 LEVEL. Would have to stay above 1.10 for a few days for momentum to continue. Volume remains strong currently but have to see if 1.10 get lifted eventually for for more upside.