Wednesday, December 31, 2014

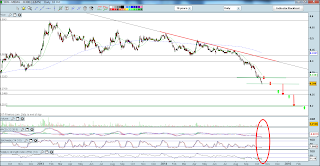
****************** Genting SP: Sell down then rebound as mentioned to clients...... CAN IT CROSS 1.10 NOW ?

Sent: Friday, December 19, 2014 10:20 AM
Subject: ******************* Genting SP: Rebounding from 1.00, price 1.045
Genting SP HAS traded lower the previous 3 sell calls to a low of 1.015 two days ago before staging a rebound. A Bullish reversal hammer has been spotted which may lead to a reversal back to 1.08 – 1.10 level. Support would currently be at 1.035 - 1.04, if it can trade above this in the coming days, may still have some upside back to 1.085 first. Note that the ultimate support level is at 1.00 still and as long as it holds above this level can consider accumulating on dips for any rebound like that seen last month.


Sent: Wednesday, December 17, 2014 10:16 AM
Subject: ******************** Genting SP: Bearish Double top pattern spotted, Heading towards 1.00 ciritcal support ? CFD SELL on this breakdown further, price 1.035
As per previous SELL CALL yesterday and last week, Genting SP has indeed broke below the 1.08 support convincingly yesterday. Temp support would probably be at 1.03 but any breakdown again get see it trade to 1.00 first. A break down below 1.00 can pave the way to 0.90 next. Careful long positions. Further CFD SELL positions on breakdown below 1.00. Lower buy stop loss to 1.055 now for current cfd sell positions.


Sent: Tuesday, December 16, 2014 9:05 AM
Subject: ********************* Genting SP: Bearish Double top pattern spotted, breaking below 1.08 again would not be positive, price 1.075, CFD SELL on this.
Seem to have broken below the 1.08 support level and hitting new lows as time passes. Sell down of 1.07 - 1.075 would be a further confirmation of more weakness. Careful long positions. CFD SELL.

Friday, December 26, 2014

**************** QT Vascular: A series OF SELL CALLs, then a potential upside breakout call last Friday.... price 0.31

Can it stay above 0.300 support now?


Sent: Tuesday, December 09, 2014 1:03 PM
Subject: ****************** QT Vascular: Weakness likely again below 0.26.... cautious long position. price 0.265
From previous call last week,  QT Vascular did not mange to climb back above the 0.300 new resistance level still. Note that downtrend can still be intact as long as 0.30 remains as the resistance now. Range would be 0.26 to 0.30. Below 0.26 would not be good and it can push towards 0.200. Careful long positions below 0.25. 20 DAY MA line still trending downwards gradually and a reversal upwards don’t look like anytime soon. Note that at current levels, it is an all time low, even below the low set in May this year which can be seen as negative in the mid term too.


Sent: Monday, December 01, 2014 10:48 AM
Subject: ****************** QT Vascular: Weakness likely again below 0.29.... cautious long position. price 0.285
Just have to be careful as it has broke the 0.300 support as mentioned last week. There can be more downside to 0.25 then 0.20 if it remains below this new support turned resistance level. Trend lines still pointing lower and a NEW LOW currently which is not a good sign.

Sent: Tuesday, November 25, 2014 9:37 AM
Subject: ********************* QT Vascular: Weakness likely again below 0.29.... cautious long position. price 0.300
QT Vascular may have found a support around the 0.29 – 0.295 level. This was also the support seen in April this year before it rebounded to above 0.500. Note that any breakdown below 0.29 will not be a good sign and we can likely see it trade lower to 0.25 then 0.20. Has been resisted by the downwards sloping trend line since July with 20 DAY MA green line still sloping downwards consistently. Careful of the breakdown.


Sent: Monday, November 10, 2014 9:14 AM
Subject: ********************* QT Vascular: Immediate support breakdown seen, price 0.315, Weakness likely.... cautious long position.
From previous sell call, QT Vascular resistance has still been at 0.37 and it did not manage to break upwards above it. Has been consolidating from 0.32 to 0.37 for about 3 weeks and today we have seen it breakdown the 0.32 support on stronger than average volume. Likely to head lower to test next critical support at 0.300 which was the low set in May this year before it rebounded. 20 day MA LINE still sloping downwards since July already and no reversal insight below 0.37 resistance still. Note that any breakdown of 0.300 support can signal a new down phase to 0.25 possible to find a new low. Cautious for long positions.


Sent: Wednesday, October 15, 2014 9:53 AM
Subject: Follow Up ************************ QT Vascular: Back to 0.34 support level, poised for more downside below.... price 0.345
From previous note on QT Vascular, it did not manage to cross above 0.40 resistance level and has instead broke below consolidation support at 0.37 a few days back. Next support is now at 0.34 level which it is still testing. May consolidate from 0.34 to 0.37 first before more direction. Break below 0.34 can see it go to 0.30. As long as 0.37 is a resistance, don’t look positive in the short term, especially with a weak overall market. Stochastic and MACD indicator still sloping downwards consistently with 20 day ma SHORT term line too.

Monday, December 22, 2014

**************** Ezion - Could be a temp rebound in place if 1.135 - 1.14 resistance clears, price 1.125 ( NOW 1.15)

Breakout seen after Email call to clients at 9.18am this morning when it was at 1.125. Did you receive the SMS TOO?

********************* Temp Rebound: RH Petrogas - A series of rebound calls since last week, PRICE NOW 0.415

What do you think? Can it stay above 0.400 now to head higher ?

Sent: Friday, December 19, 2014 9:08 AM
Subject: ********************** Temp Rebound: RH Petrogas - More upside 0.41 still, raise stop loss, price 0.405
As mentioned over the past few days, RH Petrogas has headed higher to the next resistance at 0.41. For those that has entered early, good to also take profit but note that clearing above 0.41 can give way to more upside too. Raise stop loss to 0.395. Support would be at 0.400 currently. Target would then be to 0.46 then 0.50 which was the original support in Oct and November.

Sent: Thursday, December 18, 2014 11:21 AM
Subject: ************* Temp Rebound: RH Petrogas - may be good for a short term technical rebound above 0.35 - 0.355 resistance level, price 0.37
Raise stop loss to 0.345 level. Volume stills seems strong as it pushed above past few days high again. LIKELY to head towards 0.400 resistance level. Let’s see if 0.37 – 0.375 clears out next. As long as 0.35 remains as the new support now, there can be a short term retracement especially for oil and gas counters which has been battered down.

Sent: Tuesday, December 16, 2014 9:24 AM
Subject: ************** Temp Rebound: RH Petrogas - may be good for a short term technical rebound above 0.35 - 0.355 resistance level, price 0.36
RH Petrogas has consolidated about a week below the 0.355 resistance level after the sell down seen and today we have seen some actions again back above the support turned resistance at 0.355. MACD on the verge of crossing over with RSI showing some signs of reversal. AS long as it manages to stay above 0.35 now, can see it trade back up towards 0.39 to 0.41 level. Stop loss at 0.335 for long positions. Note that downtrend is still intact with 20 day MA line still sloping downwards and this could just be a temp retracement.

Wednesday, December 17, 2014

*********************** Noble Group: SELL CALLS previously, NOW 1.03, Can the 1.00 level hold ?

Sent: Tuesday, December 16, 2014 10:57 AM
Subject: ************************* Noble Group: Testing 1.10 psychological support now, price 1.095 , CFD SELL on a further breakdown.
As per trading call yesterday, noble has traded lower at tested the 1.10 support level. Be careful of a further breakdown below 1.10 psychological support though. Any huge throwing seen at 1.09 – 1.095 can lead to the next wave of downside that can see it trade to 1.05 then 1.00 as mentioned yesterday. Cfd sell positions can be used again to ride the downside while lowering buy stop loss level. Both Stochastic and RSI trending down even stronger on today’s price actions but more confirmation needed on a clear breakdown below 1.10 support.

Sent: Monday, December 15, 2014 9:47 AM
Subject: ************************** Noble Group: Broke recent 1.145 low again, more downside Likely below it, price 1.13 - CFD SELL
Noble has broken the 2 weeks low of  1.145 today on TOP 20 volume in a further sign of weakness... Note that this can pave the way back to the 1.10 – 1.11 temp support level. Any throwing below 1.10 support can see it go down more to 1.05 then 1.00. Cautious long positions. Descending triangle pattern spotted which can suggest some weakness with 20 DAY MA also firmly trending lower. As long as 1.15 stays as the new resistance, we are still short term bearish can to hold CFD sell positions. Will add more SELL positions on further breakdown below 1.10 support.

Tuesday, December 16, 2014

*********************** Bearish Setup: Cosco Corp - Break down of 0.57 support level can see it trade lower to find a new low, price 0.555( NOW 0.54)

Heading towards 0.50 support soon ?

*************** STI Direction: Broke below 3300 yesterday, Bearish Double top spotted - where to now ? STI - 3259 NOW

Sent: Tuesday, December 16, 2014 10:19 AM
Subject: **************** STI Direction: Broke below 3300 yesterday, Bearish Double top spotted - where to now ? STI - 3259 NOW
STI has been supported about a month above 3300 but yesterday we have seen some weakness in the general market with selling seen in blue chips like banks and Oil and gas firms across the board. Today, it has again broke below the temp 3275 support level which was the support last month. This can be the beginning of more market weakness ahead with short term target AT 3235 then 3200, 3150 strongly.  A Bearish double top formation seen currently. Note that what we are seeing now could be the same as in September where it traded down from a 3360 to 3150 before finding a support. CFD SELL for STI INDEX can be used to ride any downside.

******************** Genting SP: Bearish Double top pattern spotted, breaking below 1.08 again would not be positive, price 1.08, CFD SELL on this. (NOW 1.05 !!!)

Cfd SELL Calls for Genting sp last Friday AND the week before !!!! were you aware ? NOW 1.05 !!


Sent: Friday, December 05, 2014 9:22 AM
Subject: ********************* Genting SP: Bearish Double top pattern spotted, Back to support level at 1.10, breaking below again would not be positive, price 1.095
For the past 2 weeks, Genting SP has been trading sideways from 1.10 to 1.15-1.16 resistance level. Did not manage to break above the 1.15 – 1.16 levels convincingly. Seems like a double top pattern spotted at the 1.15 level which can suggest some weakness still back to 1.00. Any throwing at 1.09- 1.095 at buyers would not be good. This support also coincides with the 20 DAY MA LINE. MACD and Stochastic looking at a bearish crossover with more downside likely if 1.10 does not hold. Cautious long, CFD SELL to ride any downside.

Monday, December 15, 2014

*************************** Noble Group: Broke below critical 1.16 support again, more downside Likely below it, price 1.155 - CFD SELL (NOW 1.12)

From last week SELL CALL, noble has indeed broke below the 1.145 support level….. towards 1.10 now ?

************** Midas: Series of Sell calls seen......... INDEED broke below 0.25 support as mentioned to clients on friday.

More downside still ? now 0.24


Sent: Friday, October 17, 2014 9:52 AM
Subject: Follow Up************** Midas: Potential Breakdown further below 0.30, now 0.29
From previous sell call, Midas did break below the 0.300 psychological support again. This can again lead to more downside to 0.27, 0.25 then 0.20. Note that 0.25 is the all time low seen Oct 2008 before it rebounded. Any breakdown will not be a good sign and can lead it to find a new low again at probably 0.200 first. STILL A CFD sell as long 0.300 remains as a resistance now. Lower buy stop loss to 0.31 now. Congrats to those who have shorted under CFD. All technical indicators still looking weak with no signs of any recovery as of now, see emails all the way down, you can see that sell calls since MAY ALREADY.

Friday, December 12, 2014

******************** Bullish Setup: Artivision - Breakout above psychological 0.070 resistance can lead to a recovery, price 0.072 (NOW 0.077)

Sent: Thursday, December 11, 2014 9:46 AM
Subject: ******************** Bullish Setup: Artivison Breakout above psychological 0.070 resistance can lead to a recovery, price 0.072
From trading call last month, Artivision did not manage to break out above the 0.095 reistance level and has since traded down to below 0.070. It has consolidated below 0.070 with a low at 0.066 for a few days before breaking upwards again on top volume seen today. This could be the start of a recovery back to 0.080 then 0.084 first. Imeediate resistannce would be at 0.075, if it manages to stay above 0.070 in the coming day, it can trade upwards to test this 0.075 and attempt a breakout further. Both Stochastic and RSI indicators are on the verge of a crossover reversal which can suggest a recovery back. Stop loss at 0.068 for any long positions.

Wednesday, December 10, 2014

Yuuzoo - selling pressure then recovery as emailed to clients.....

FROM yesterday’s call at 9.57am, Yuuzoo has indeed break above the temp resistance at 0.42 – 0.425 in the afternoon yesterday and today hit a high at 0.455,can it trade back to 0.500 ?


Sent: Thursday, December 04, 2014 1:05 PM
Subject: ******************** Yuuzoo - Downward reversal in progress, careful long positions, price 0.43
After trending all the way up to a high of 0.625, Yuuzoo has broke below the 0.49 support yesterday on strong volume and today we have seen it broke the immediate 0.45 support level too. Likely to head lower to test the 0.42 support which coincides with the 20 DAY MA line. After that will be 0.40 then 0.32 which was origincally where it broke up from last month. MACD looking at at bearish crossover downwards with both RSI and Stochastic already reversing dowmwards. Carefull long positions and be discipline if 0.40 psychological support does not hold either.

Tuesday, December 9, 2014

***************************** Hankore Env - Upside then downwards reversal as predicted.....

Broke 1.00 support yesterday and we were alerted, so were our clients.  Now at 0.94, ooooops


Sent: Thursday, November 13, 2014 9:43 AM
Subject: ***************************** Bullish Setup: Hankore Env - Breakout seen coupled with Takeover news of peer... price 0.955
Entry: 0.94 to 0.96
Target: 1.00 then 1.10
Stop loss: 0.925
Reason: Strong volume breakout above 0.94 resistance coupled with NEWS OF United Envirotech takeover can be a catalyst for more upside. 20 day MA line reversing upwards strongly at the initial phase with much more room to go. All technical indicators trending upwards firmly too.

********************** Bearish Setup: Ezra, price 0.695, breakdown of 0.700 seen, CFD SELL (NOW 0.54)

Broke support 2 weeks ago with an email to clients and more downside ever since……. Where to now? Price NOW AT 0.54, can the 0.500 hold?

Friday, December 5, 2014

****************** Mirach Energy: a series of sell calls - NOW 0.089

What a sell down seen, more downside?


Sent: Wednesday, November 26, 2014 10:03 AM
Subject: **************** Mirach Energy: Breakdown of 0.130 support will not be good, careful long positions, price 0.129
Looks a little shaky as it attempts a breakdown of 0.130 support level as mentioned last week. Further confirmation on throwing seen at 0.128-0.129 level, where we can see more seller coming in after that. CFD  sell  on a convincing support breakdown, Target to 0.120 next.