Wednesday, October 30, 2019

AEM: Quite a good spike caught then some profit taking. Price 1.45. Uptrend may not be over...


Just about 2 weeks back, we spotted AEM approaching the key 1.30 resistance level…


This level was key has it has been trading below since May last year and buyers were just not able to lift it off..


Tested for close to 4 times but failed always..


But this time, it was different, there were some signs of the uptrend starting to take shape as it approach the 1.30 resistance.


Hence, some upside targets were drawn with a potential break out expected…


See what I mean below..


Early last week, the bullish move that we were waiting eagerly for indeed came,


It was attempting to break the 1.30 level and buyers were ready to push it higher..


Some bullish price actions was spotted as it happened and upside target reiterated as seen below.


You can see that after 1.30, there was quite a huge gap to clear and hence quite a good reward to risk ratio for any long position to be taken.


The reversal to the upside looks set to continue as per our targets..


Over the past few days, the 1.40 resistance gave way too,


And we have managed to push higher to a high of around 1.53 before some profit taking came back..


This is normal given that we have surged from 1.30 all the way to more than 1.50 in a few days which is more than 14% gain.


For now, likely to see some support coming back from 1.40 where it may consolidate above before attempting to push towards 1.60 target as drawn…


The uptrend still looks good if it holds above 1.40 now and there may be more legs to the rally after a rest..


Still in our watch list…


Wednesday, October 23, 2019

CityDev: A bullish move finally seen as predicted. More upside from here? Price 10.67.


Just about 2 weeks back, we saw CityDev approaching the key 10.00 resistance level


It had been trading below this level for more than a year with it testing it for more than 2 times but failed to get above..


This time, it was nearing it again after some consolidation above 9.50 for a few weeks..


More importantly, there were already signs of the uptrend starting to take shape from indicators,


Hence, a potential move up was expected and some targets were drawn… it was then around 9.77.


Target was to 11.00 first,


See what I mean below.


Last week, true enough, the move came..


It was pretty fast with buyers just coming in to clear out all sellers at 10.00,


And it just started rising fast.. Uptrend was looking good on this move..


Targets were again reiterated towards 11.00 first and maybe even higher where a 2nd target is drawn..


Was quite a bullish move up after the consolidation below 10.00 for more than a year as mentioned…


Over the past few days, we have seen the temp 10.50 resistance gave way too and with CityDev pushing higher…


Likely to see some profit taking as it nears 11.00 for now,


But uptrend may not be above if it can hold above 10.50 higher support..


Indicators still pointing towards more upside for now..


Watching to see if target can be hit, but quite a good run seen..


Friday, October 18, 2019

Mapletree Ind Trust: Is the uptrend over? I doubt so for now.... Rebound caught! Price 2.59


Slightly more than 2 weeks back, we saw Mapletree Ind Trust selling down towards it key 2.40 support..


This level was crucial as it was the resistance it actually broke above last month…


It had then traded all the way to near 2.60 before some heavy profit taking…


So when it traded back to this 2.40, this could be where buyers may be looking to bargain hunt  again…


In addition, it also coincides with the 20 days moving averages which lends some support..


Hence, expecting the uptrend to continue further, some upside rebound targets were drawn back towards 2.60


See what I mean…


Over the past 2 weeks, we have indeed seen the rebound off the 2.40 support level taking place…


Buyers came back bit by bit and regained control again as prices pushed away from 2.40…


It broke the 2.50 over the past few days, approaching the 2.60 target as drawn…


We may see some profit taking near here again given the rebound over the past 2 weeks but..


Awaiting more bullish actions above 2.60 which can see the uptrend continue…


Looking at a really good firm uptrend for now based on trend indicators…


Monday, October 14, 2019

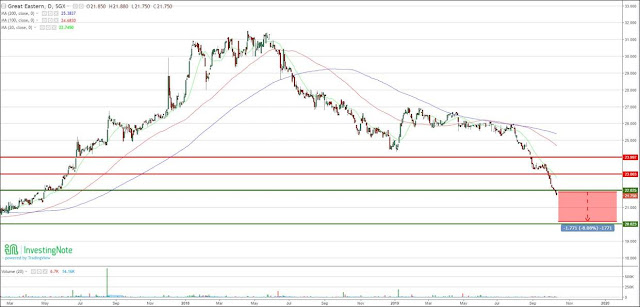
Great Eastern: Downtrend to continue for shorts? Sellers still seems to be in charged! Price 21.75


Just 3 weeks back, we spotted Great Eastern approaching the KEY 23.00 support dangerously


It has been pushing lower after each consolidation since August and hence there were definitely some signs of weakness


In fact, trend indicators were also pointing to more downside


Some downside targets were drawn with a potential break down of 23.00 expected eventually..


See what I mean below…


Buyers seems like that were not able to hold any longer and sellers were attempting to regain control again..


Over the next few days after spotting, indeed, the break down occurred at 23.00 and sellers took price lower…


Target were again reiterated with a sell down towards 22.00 expected next…


That was the next crucial support based on prices 2 year back where it held,


And this is also where we may start to see some short covering.


Downtrend was intact on this move down…


Last week, we traded lower towards 22.00 and seems like this support has given way as well..


Which opens up the way to our next target towards the psychological 20.00 as drawn all along..


With price holding below 22.00 now, still looks bearish and sellers can continue to push lower after a slight breather…


For those who have taken shorts earlier, would be good to start protecting profits while riding further…


More for CFD Shorts to profit from the downside rather that just holding on blindly to long positions..


Will be looking to see when target at 20.00 can be hit eventually…..


Wednesday, October 9, 2019

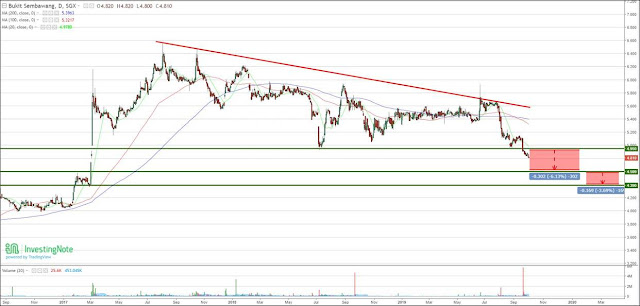
Bukit Sembawang: Selling still not stopping? To ride downside further.... Price 4.76.


Just about 2 weeks back, we spotted Bukit Sembawang heading towards the key 4.95 – 5.00 support level..


This level was definitely one to watch as we have been holding above for more than 2 years and..


We have rebounded from it about 3 times..


But this time, things seem to be different with some signs of weakness creeping in.


From the trend indicators, some downside was also starting to show….


And hence some targets were drawn for a potential breakdown… see what I mean…


First target to 4.60 first…


Last week, more selling came and buyers were just not able to hold above the support at 4.95 as mentioned earlier…


Sellers managed to regain control and were ready to take prices lower..


Managed to see selling all the way to 4.80 where there were some slight support…


But downside targets were again reiterated, to 4.60 then even lower to 4.40 if that fails to hold too..


Over the past few days, seems like 4.80 is not holding either….


More downside possible from here…


Hope that no one is holding on to long positions… More for shorts with CFD to ride further weakness while protecting profits…


See where we are below and targets drawn which can still play out…


Friday, October 4, 2019

BreadTalk: Sellers still not letting go? Price 0.595. Downtrend firm for now...


Just about a month ago, we saw more weakness in BreakTalk with it heading towards the next support at 0.63..


This level was key as we had seen support above here more than 2 years back in 2017..


Buyers were likely to come back for some short covering,


However, more downside was still possible, especially with the downtrend indicators pointing firmly to more selling…


Hence, targets were reiterated to the downside with a potential breakdown below this 0.63 level expected…


See what I mean below…


2 weeks passed and indeed, the 0.63 support gave way,


Buyers were just not able to hold any longer as expected…


Targets were reiterated again all the way towards 0.50 with some temp support at about 0.55..


Sellers seem to be willing to push even lower towards target….


There were some consolidation above 0.60 but short term downtrend can continue imo with indicators still bearish…


Fast forward and over the past few days, we have seen the 0.60 psychological support broken too…


We can expect more selling towards target with downtrend intact


Definitely would not want to be holding on to this counter blindly for now.. More for CFD shorts to ride further weakness…


Not too sure how low it can go, but so far, we have seen more weakness after some slight consolidation,


Forming lower lows as a result which is not a good sign


Let’s see when downside targets can be hit… maybe soon?


Tuesday, October 1, 2019

Penguin Intl: Uptrend still continuing strongly? Pushing higher for now... Price 0.61


Just about 2 weeks back, we spotted Penguin approaching the 0.55 resistance which it had traded below for more than a month..


There were some signs of bullishness and also the potential for this key obstacle to give way..


The trend was slowly firming up to the upside and buyers seems to be willing to push more after each consolidation..


Hence, some target were drawn with the first one to 0.65..


See what I mean..


Just last week indeed, we have seen the 0.55 level lifting off where it neared 0.600..


And some profit taking…


Was expecting some consolidation again before further upside..


Targets reiterated upwards with support at 0.55 now..


Potential for it to break the 0.60 to push higher… See what I mean..


Seems like we are indeed seeing more bullish price actions coming back today with 0.600 sellers cleared.


Trend indicators are still looking positive on this move where uptrend can still continue..


Target revise higher to 0.700 as seen below for the updated chart..


Will see how far it can push..


Likely to see some profit taking along the way, especially near 0.700 before some consolidation again…


Quite a good run so far over the past 2 weeks.. See where we are below now.